Time-Series Forecasting of Crime Rates in Michigan
Computational Modeling & Data Analysis
CMSE 201 | March 2023 – May 2023

Project Overview
This data science project analyzes crime trends in Michigan from 2008 to 2019, examining four major crime categories: Murder, Assault, Robbery, and Rape. Using Python-based statistical analysis and time-series forecasting, the study identifies patterns, measures crime rate distributions, and builds predictive models to forecast future trends through 2030.
→ Applied curve-fitting techniques with quadratic and exponential models to predict long-term crime trends
Approach Overview
Background & Motivation
Context
Crime rates in the United States vary significantly across states, with Michigan consistently ranking among states with higher violent crime rates. According to USA Today, Michigan ranks 13th among the most dangerous states, with Detroit and Muskegon Heights being particularly affected areas. Understanding how crime rates have changed over time provides essential information for policymakers and law enforcement agencies to develop effective crime reduction strategies.
Research Questions
Question 1: Overall Trends
What is the overall trend of crime rates (murder, rape, robbery, and assault) in Michigan from 2008-2019? How has it changed over time?
Question 2: Crime Type Comparison
What were the rates of the most and least common types of crime in Michigan from 2008 to 2019?
Question 3: Future Predictions
Can we predict the rates of the most and least common types of crime in Michigan through 2030?
Methodology
Data Source & Preparation
The analysis used data from the CORGIS Datasets Project (state_crime.csv), which contains crime statistics for all 50 US states from 1960 to 2019. The dataset was cleaned and filtered to focus exclusively on Michigan data from 2008-2019, examining four major crime categories: Murder, Assault, Robbery, and Rape.
Analytical Tools
- →Python Libraries: pandas, numpy, matplotlib
- →Predictive Modeling: curve_fit from scipy.optimize
Analysis Approach
The workflow included trend visualization, comparisons across crime types, distribution summaries, basic correlation exploration, and curve-fitting models to generate 2020–2030 projections.
Crime Trends Analysis (2008-2019)
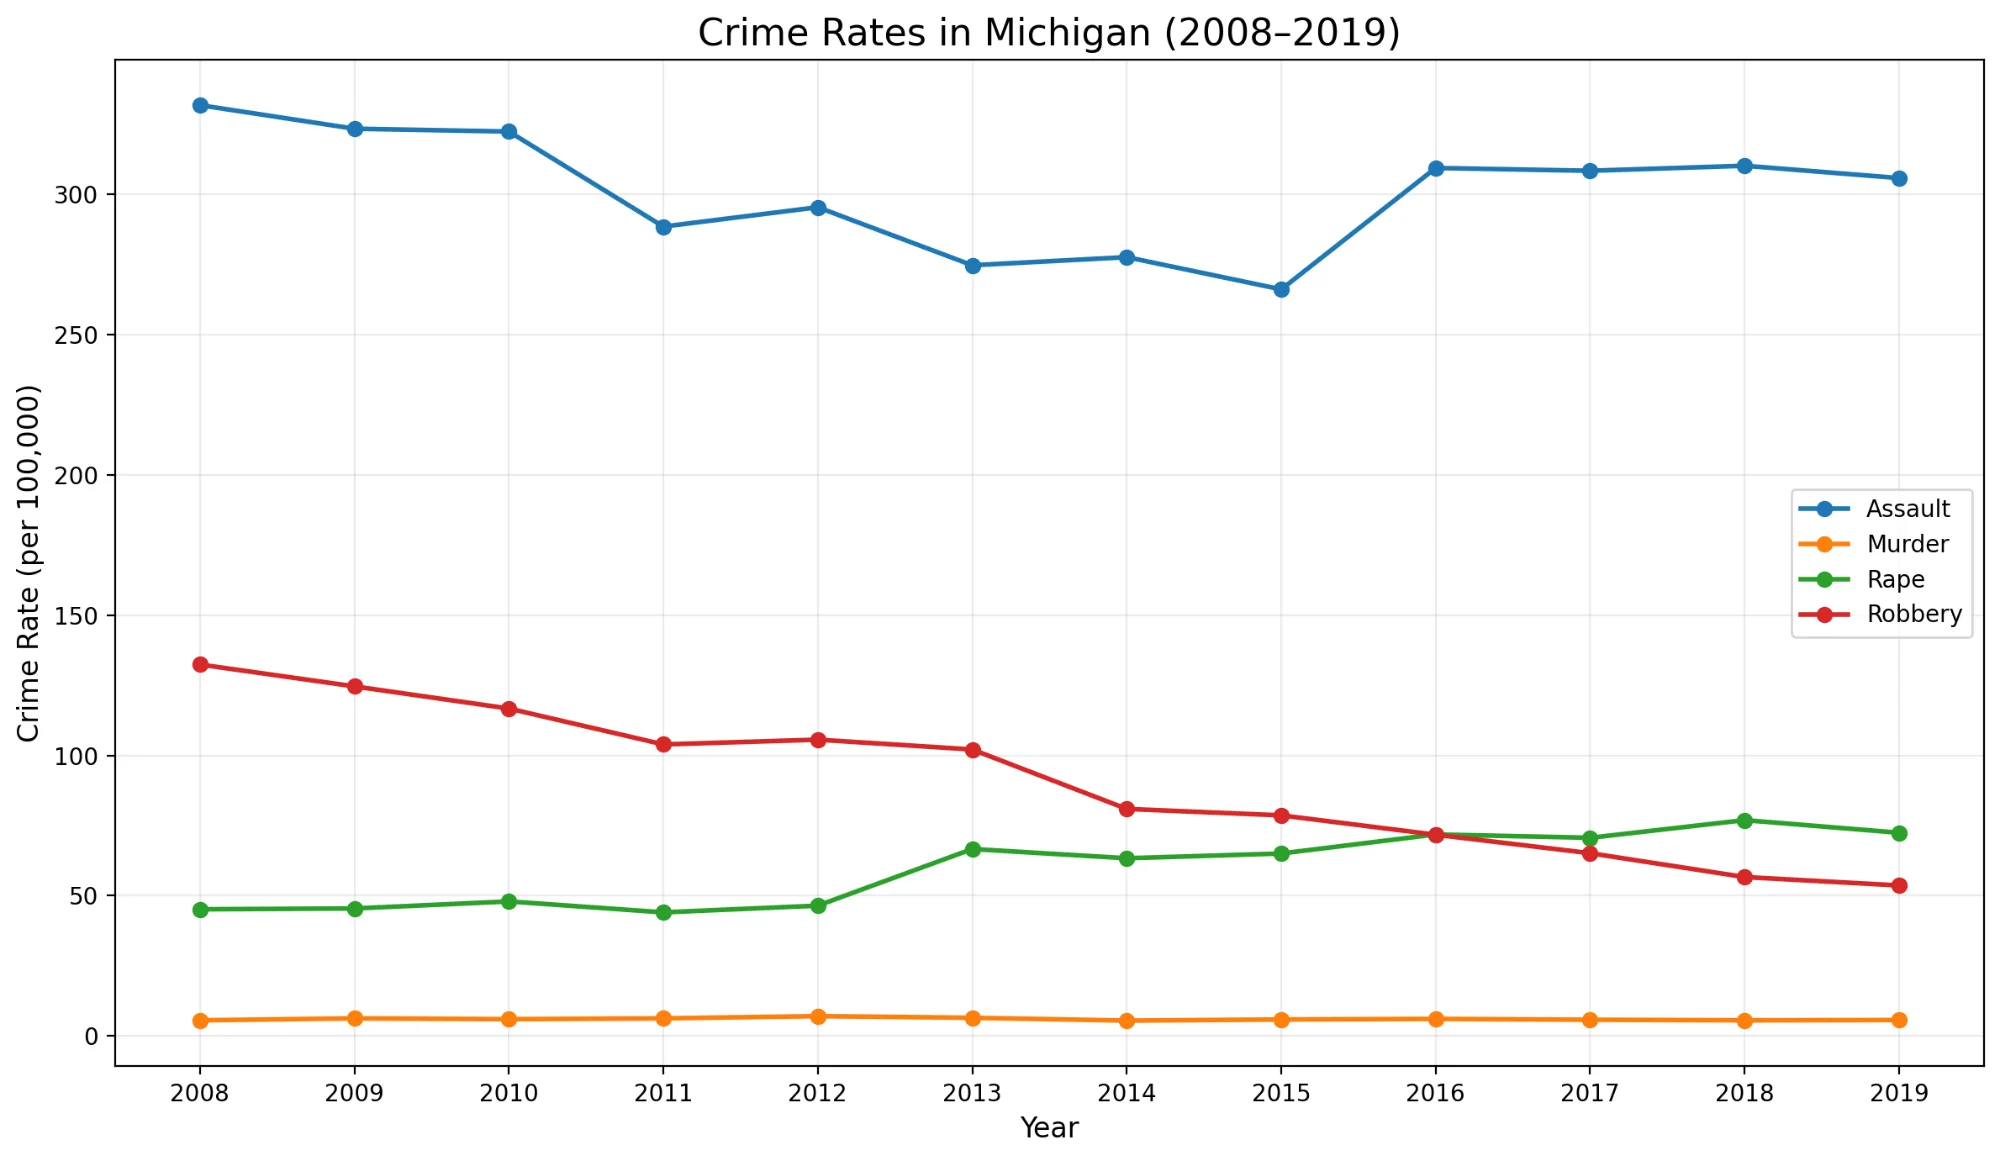
The trend analysis shows overall changes in Michigan crime rates from 2008 to 2019, with variation across categories.
Crime Type Comparison
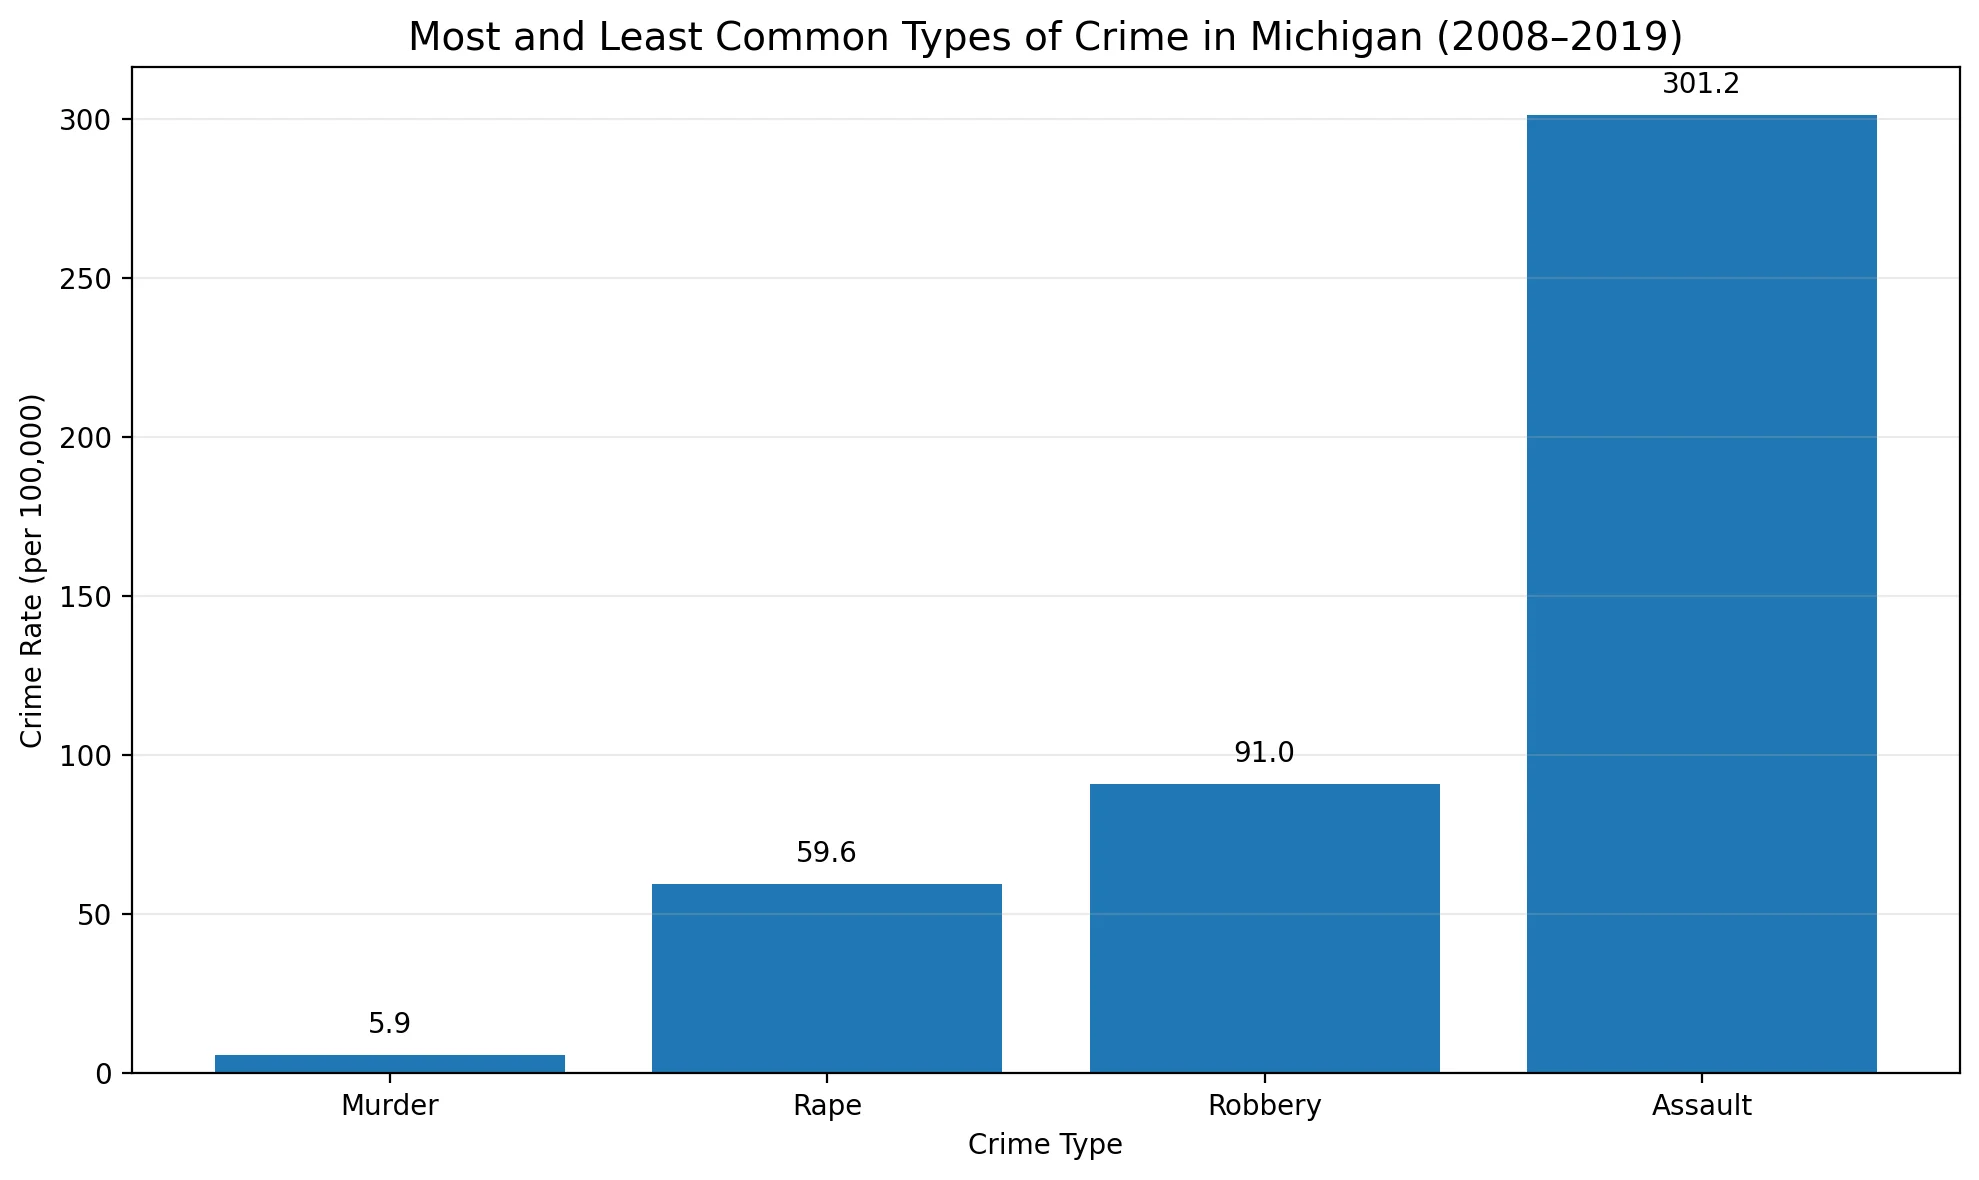
Most Common: Assault
Total Occurrences: 3,614.90
Mean Rate: 301.24 per 100,000
Median Rate: 307.20 per 100,000
Least Common: Murder
Total Occurrences: 71.20
Mean Rate: 5.93 per 100,000
Median Rate: 5.85 per 100,000
Statistical Summary (2008-2019)
Mean Crime Rates:
- Assault: 301.24 per 100,000
- Robbery: 90.98 per 100,000
- Rape: 59.62 per 100,000
- Murder: 5.93 per 100,000
Median Crime Rates:
- Assault: 307.20 per 100,000
- Robbery: 91.50 per 100,000
- Rape: 64.15 per 100,000
- Murder: 5.85 per 100,000
Statistical Distribution Analysis
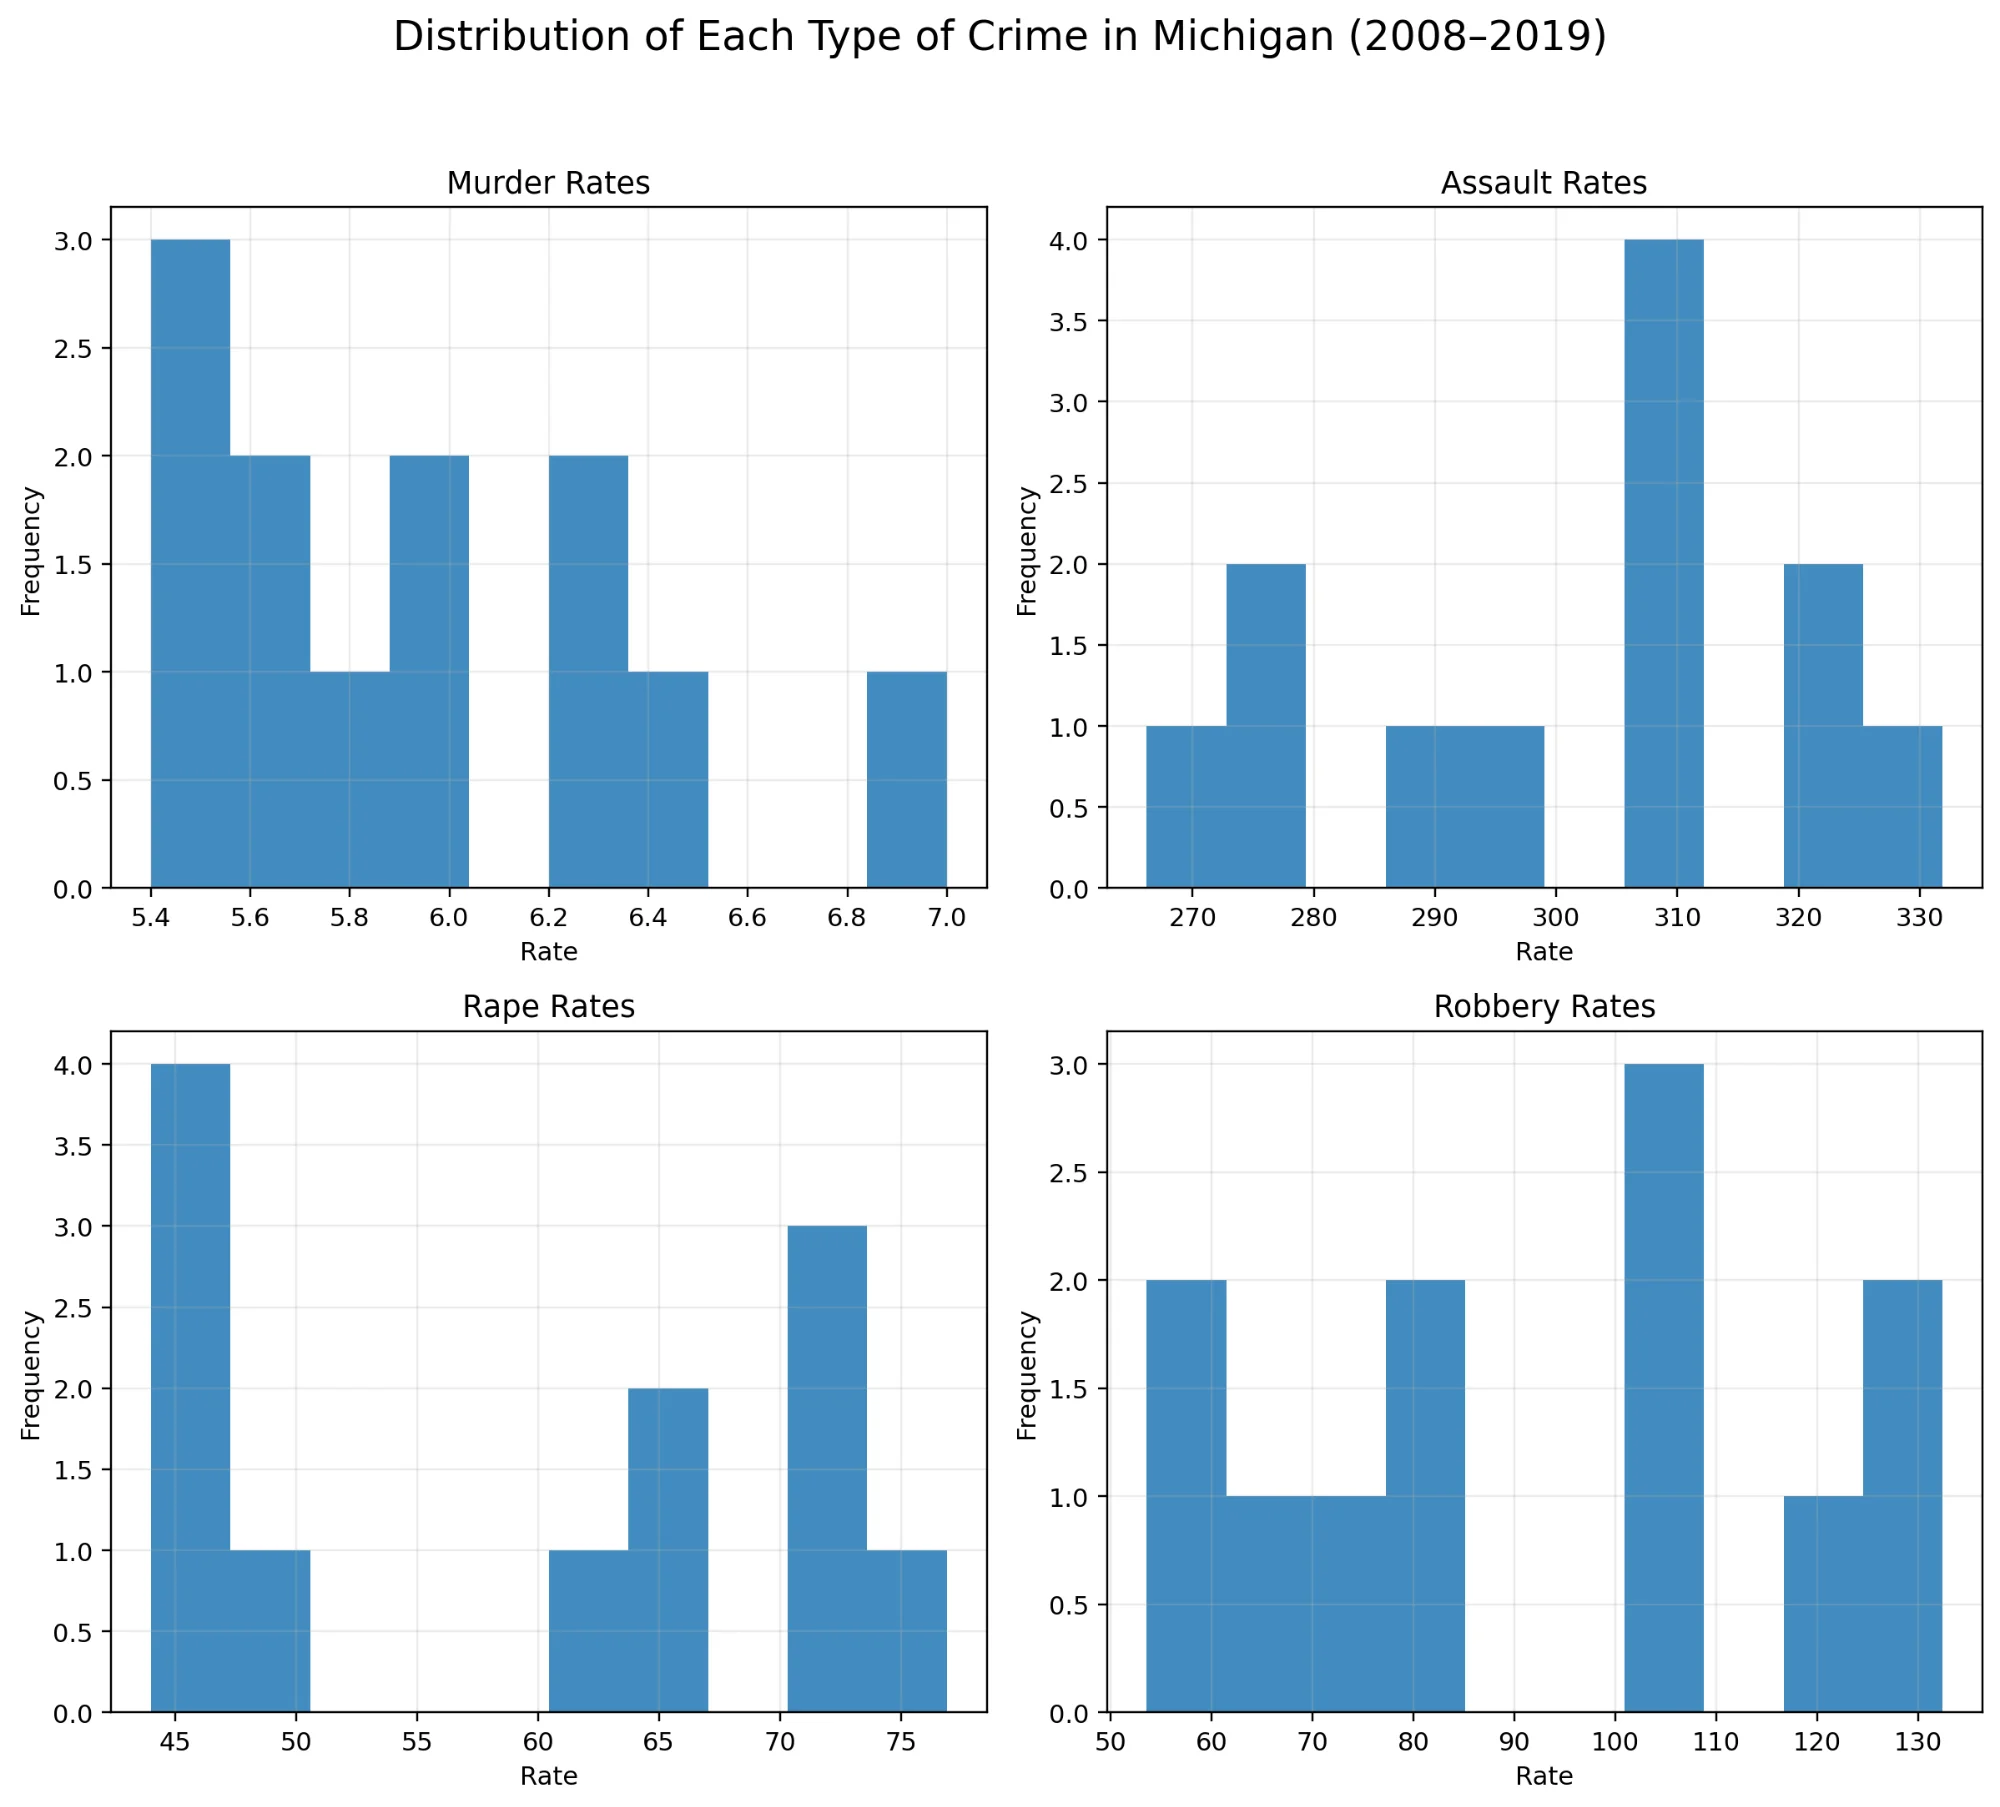
Histogram plots summarize how crime rates are distributed across the study period.
Correlation Analysis: Murder vs. Assault
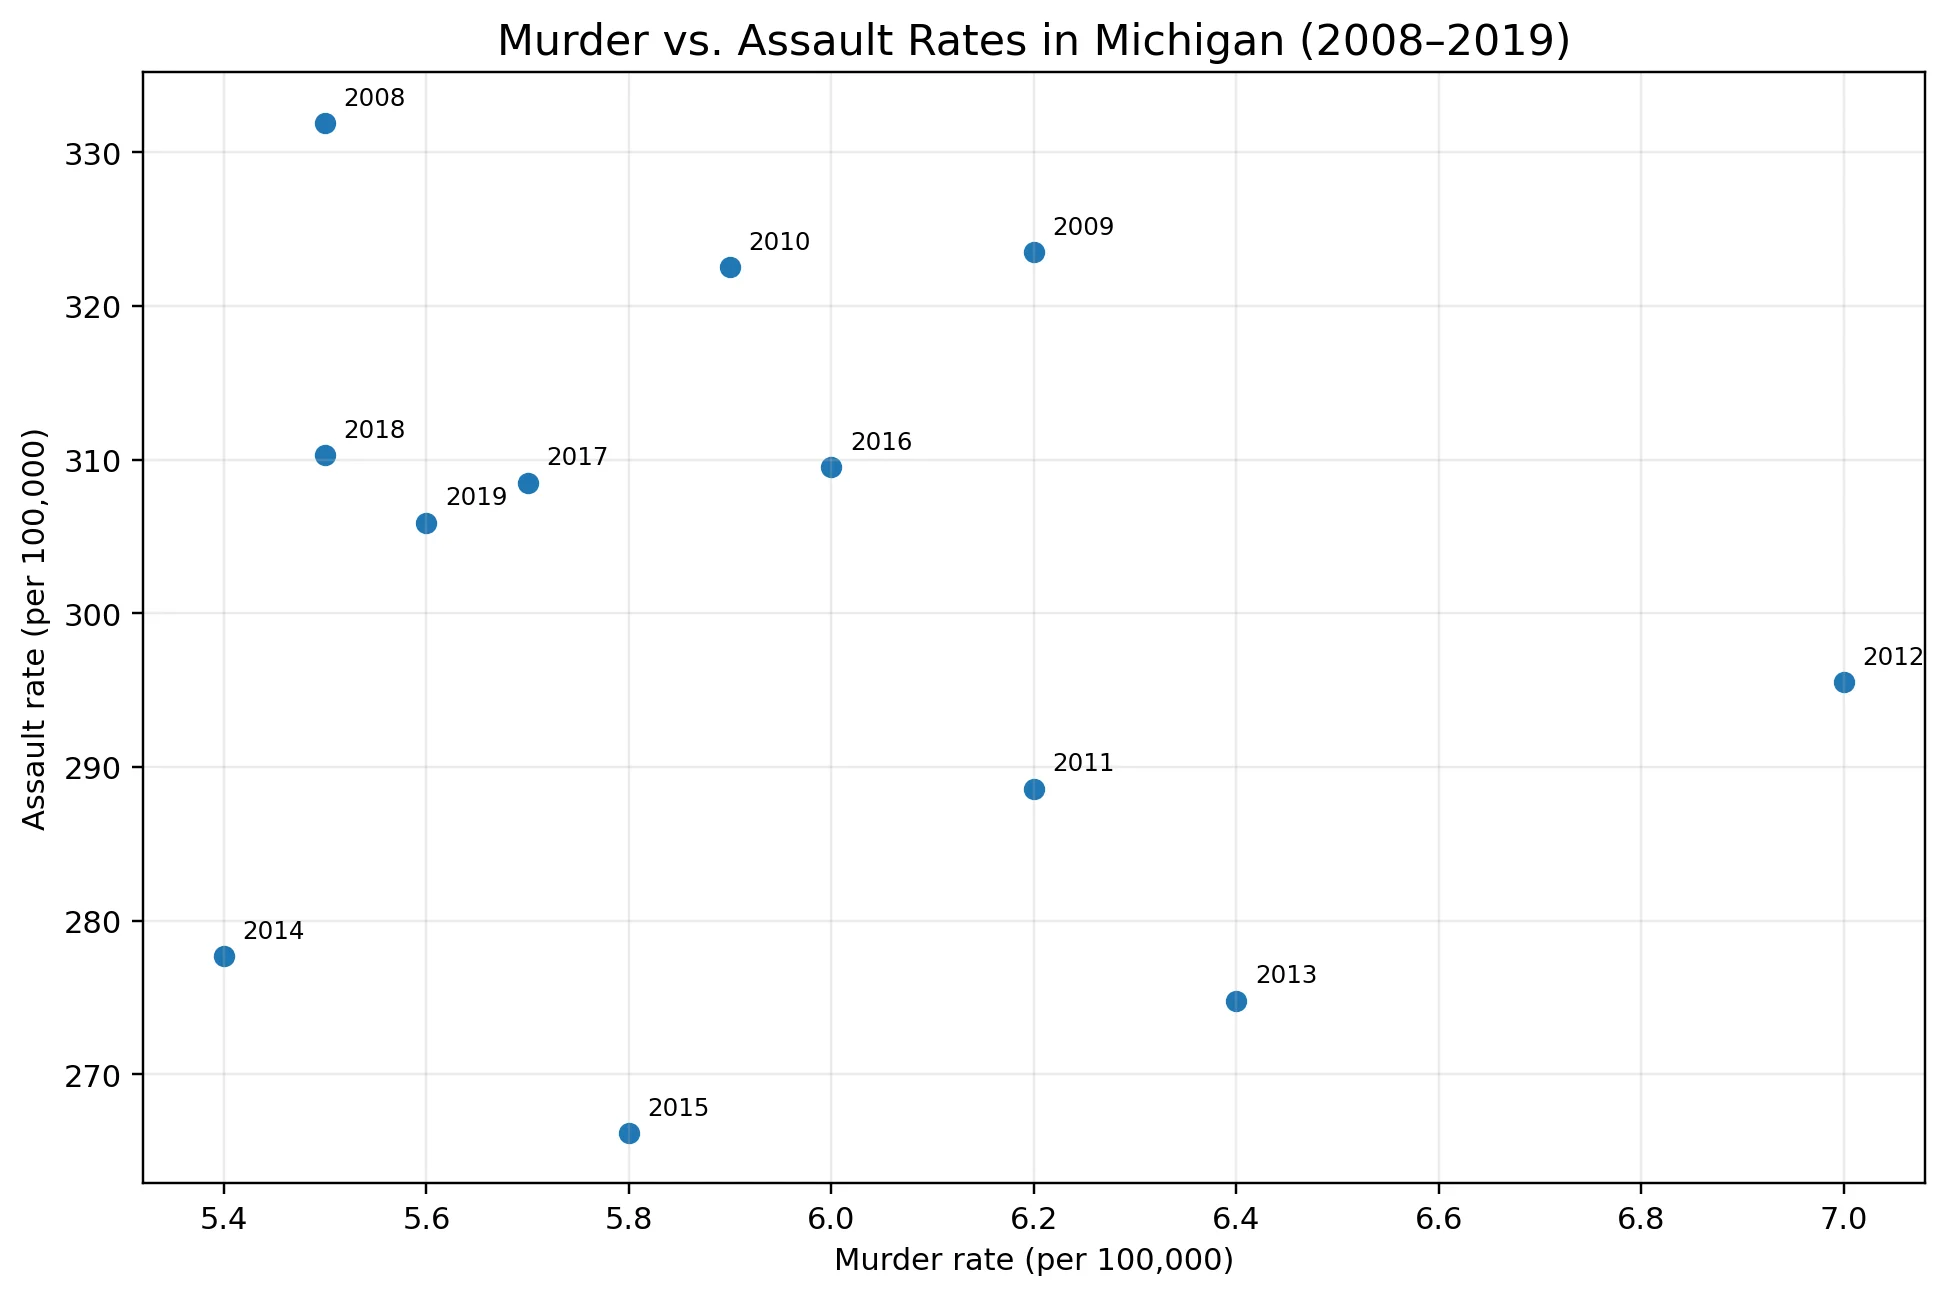
The scatter plot examines the relationship between murder rates and assault rates across the study period.
Key Findings
- →No strong linear correlation exists between murder and assault rates, indicating these crimes may be influenced by different factors
- →Murder rates remain relatively stable regardless of assault rate fluctuations
- →Assault rates show greater variability across the time period
Predictive Modeling (2020-2030)
Murder Rate Predictions
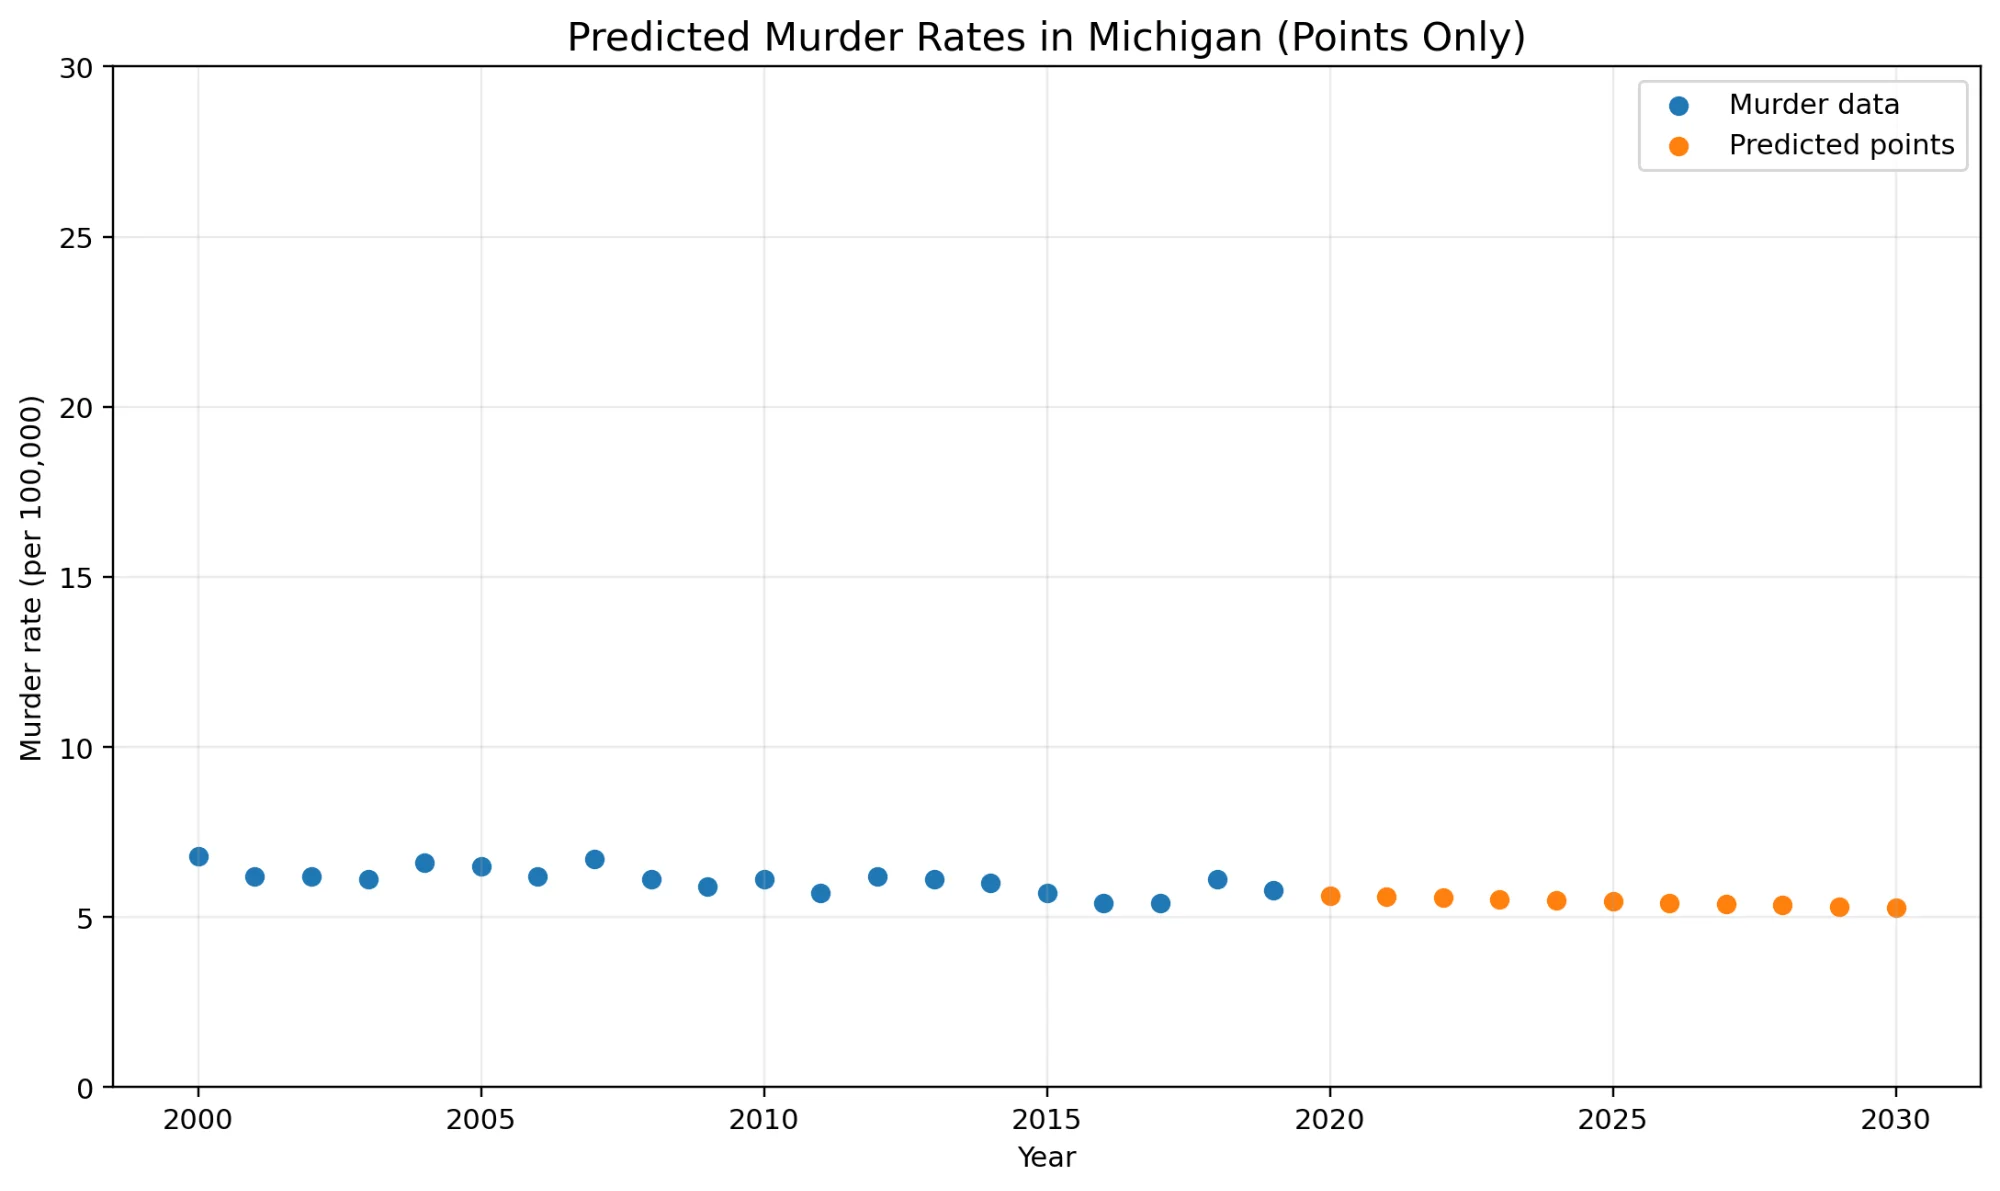
Exponential Model Results
An exponential decay model was fitted to murder rate data from 2010-2019. The model projects a continued gradual decrease through 2030.
→ The model suggests murder rates will keep trending downward
Assault Rate Predictions
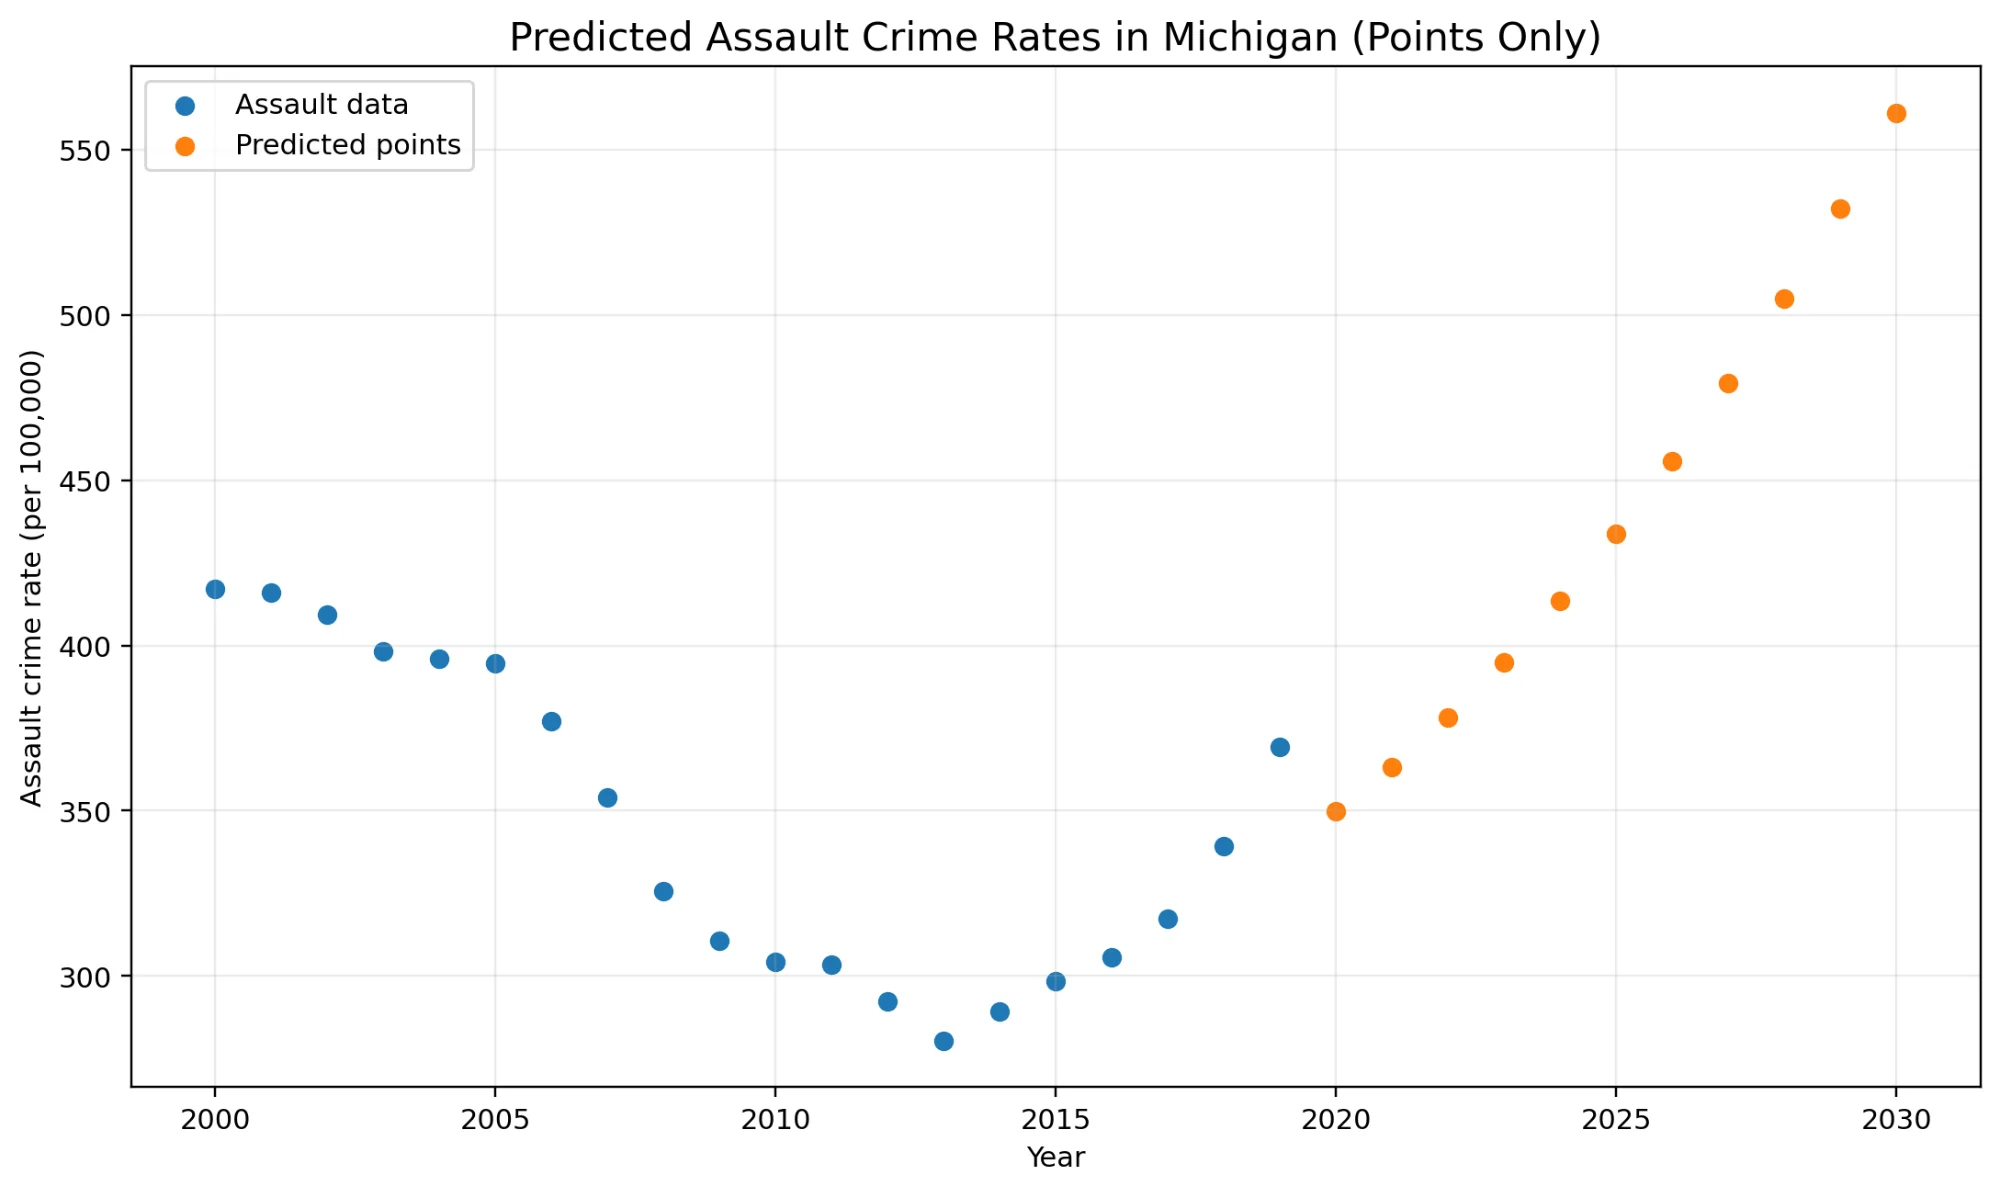
Quadratic Model Results
A quadratic model was selected for assault rates based on the trend shape in the historical data. The model projects higher assault rates by 2030.
→ This projection should be interpreted with caution
Findings & Impact
Key Findings
- →Overall crime rates in Michigan decreased from 2008-2019, with robbery showing the largest decline
- →Assault remains the most common violent crime in the dataset
- →Forecasts suggest murder rates may continue falling while assault rates may rise
Project Impact
This analysis provides evidence-based findings into Michigan's crime trends, which can inform policy decisions and resource allocation. The results highlight improvements in some categories while pointing to areas that may need continued monitoring.
→ Demonstrates how data science can be applied to real-world public safety questions