Analysis of College Football Playoff Teams: Statistical Insights and Trends
Data Science (Programming in R) | STT 180
October 2023 – December 2023
Project Overview
This data science project explored the dynamic world of college football by analyzing comprehensive statistics of College Football Playoff (CFB) teams from 2014 to 2022. Using linear regression models and data visualization in R, the analysis identified key offensive and defensive statistics that correlate with playoff success, compared the relevance of average versus total statistics, examined conference-wise performance variations, and identified statistical snubs and underperformers in the playoff selection process.
→ Applied quantitative modeling using R, ggplot2, and linear regression to uncover patterns in what makes a team playoff-worthy
Approach Overview
Research Questions
Question 1: Key Statistics
What are the key offensive and defensive statistics that correlate with a team's success in reaching the CFB playoffs? Which metrics truly matter for playoff-caliber performance?
Question 2: Average vs Total
Do average statistics (yards per game, points per game) hold more weight, or do total statistics (total yards, total points) tell a better story about team performance throughout the season?
Question 3: Conference Patterns
Are certain conferences consistently producing teams that excel in crucial statistics? How do conference playing styles and strengths differ in producing playoff-ready teams?
Question 4: Selection Evaluation
Who were the snubs - teams that put up playoff-worthy numbers but didn't make the cut? And what about teams that underperformed statistically but still secured a playoff spot?
Methodology
Statistical Modeling
Applied linear regression models to identify key offensive and defensive statistics correlating with CFB Playoff success. Used R's step function to optimize model fit and calculated R-squared values to measure predictive accuracy.
Data Visualization & Analysis
Created comprehensive visualizations using ggplot2 including conference strength scatter plots, average vs total statistics comparisons, and year-by-year analysis identifying statistical trends. All data cleaning and modeling performed in R.
Statistical Models: Offense vs Defense
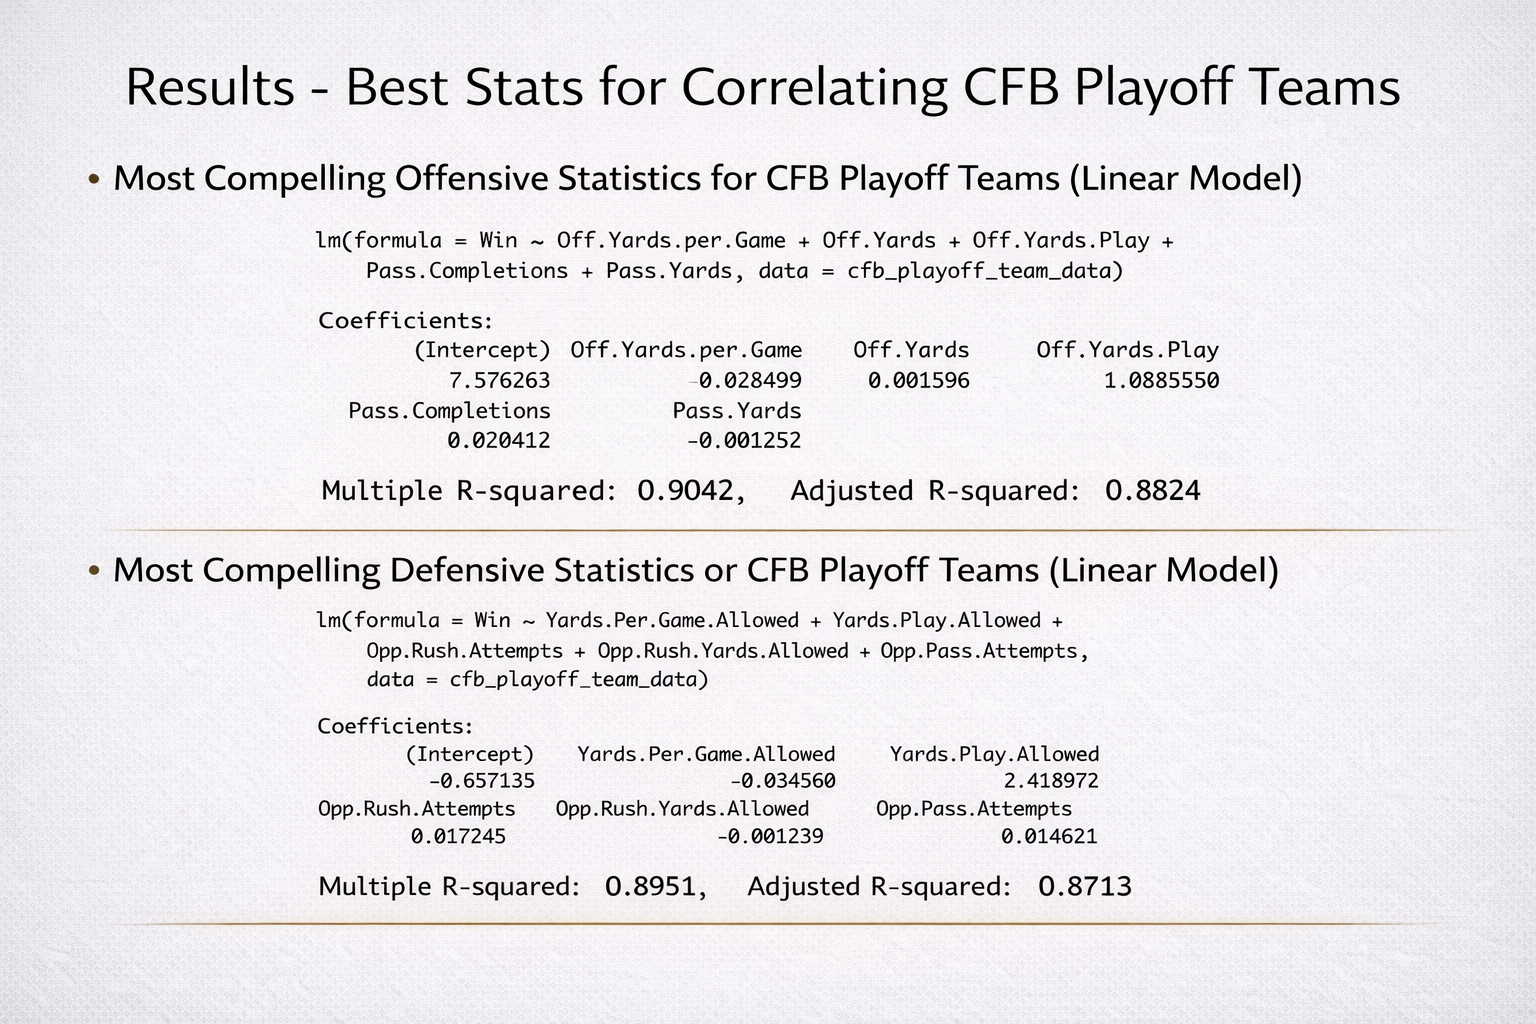
Linear regression models were developed separately for offensive and defensive statistics to determine which side of the ball better predicts playoff success.
Offensive Model Results
Key Variables:
- • Offensive Yards per Game
- • Total Offensive Yards
- • Yards per Play
- • Pass Completions
- • Pass Yards
R² = 0.904
90.4% of variance explained
Defensive Model Results
Key Variables:
- • Yards Per Game Allowed
- • Yards per Play Allowed
- • Opponent Rush Attempts
- • Rush Yards Allowed
- • Opponent Pass Attempts
R² = 0.895
89.5% of variance explained
Key Finding
Offense is a slightly better predictor of playoff success than defense (R² 0.904 vs 0.895), though both show strong correlations. While defense remains crucial, the ability to consistently score and gain yardage may have a marginally greater impact on playoff prospects.
Average vs Total Statistics Comparison

A critical comparison examined whether per-game averages or total season statistics provide better predictive power for playoff qualification.
Average Statistics Model
Variables Tested:
- • Points Per Game
- • Offensive Yards per Game
- • Yards Allowed per Game
- • Pass/Rush Yards per Game
- • Average Sacks per Game
- • Average Turnover Margin per Game
R² = 0.368
Weak correlation - only 36.8% variance explained
Total Statistics Model
Variables Tested:
- • Total Points
- • Total Offensive Yards
- • Pass/Rush Attempts and Yards
- • Total Sacks
- • Tackles for Loss Yards
- • Total Turnovers Lost
- • Total TDs Allowed
R² = 0.861
Strong correlation - 86.1% variance explained
Key Finding
Total season statistics are vastly superior predictors of playoff success compared to per-game averages (R² 0.861 vs 0.368). Total stats provide a more comprehensive view of team performance throughout the season, capturing the full extent of capabilities and consistency over time rather than game-by-game fluctuations.
Conference Strength Analysis
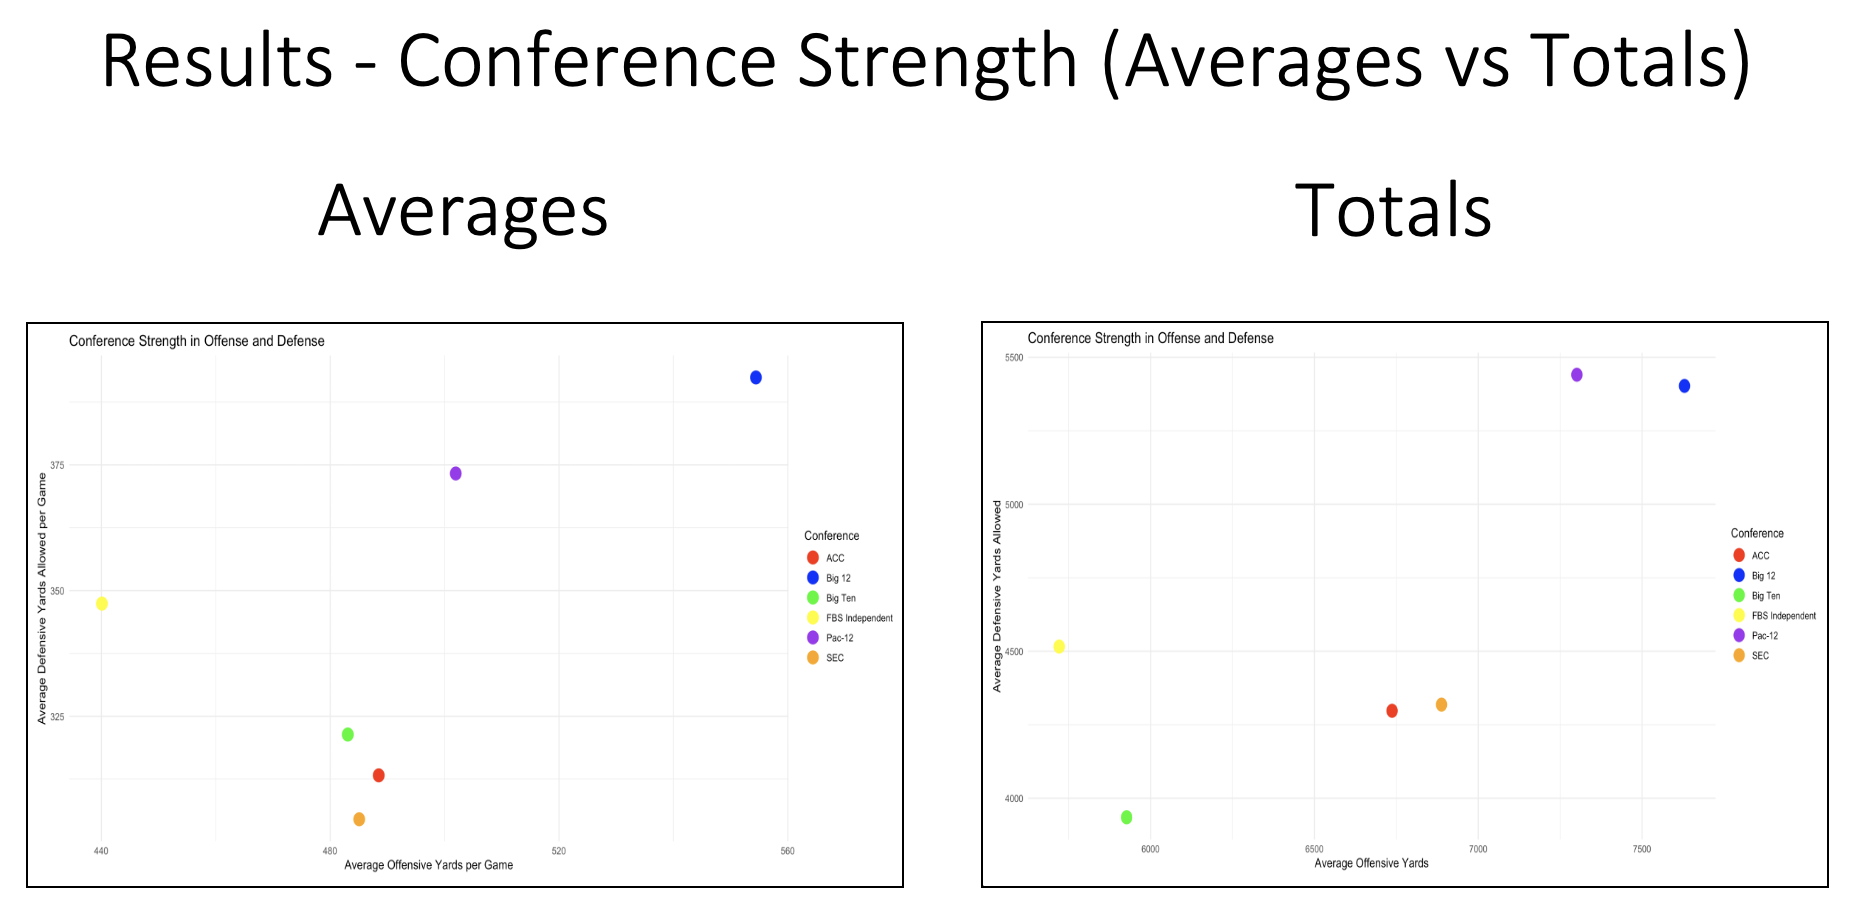
Conference-wise analysis using the correlated statistical models revealed significant differences in playing styles and statistical profiles.
How to Read the Charts
Best Position: Bottom-Right
High offensive scores + Low defensive scores (strong defense)
Worst Position: Top-Left
Low offensive scores + High defensive scores (weak defense)
Conference Performance Patterns
SEC and ACC (Best Overall)
Consistently positioned in the bottom-right quadrant across both average and total statistics, indicating strong balanced performance with excellent offense and defense. These conferences produce the most playoff-ready statistical profiles.
Big 12 and Pac-12 (Offensive-Oriented)
Higher offensive yards but relatively weaker defensive statistics, reflecting high-scoring, offensive-oriented playing styles. Strong in generating yardage and points but more vulnerable defensively.
Big Ten (Balanced Approach)
More defensive-oriented with lower offensive totals but strong defensive metrics. Balanced approach with moderate offensive and defensive scores, representing a more traditional, defense-first philosophy.
FBS Independent (Varied)
Varied positioning showing diverse playing styles among independent teams without consistent conference patterns or strategic uniformity.
Key Finding
Conference variations reveal strategic and stylistic differences in approaches to the game. SEC and ACC consistently produce the most playoff-ready statistical profiles with balanced excellence. Total statistics analysis provided clearer separation between conferences than averages, further validating their superiority as predictors.
Playoff Snubs & Underperformers Analysis
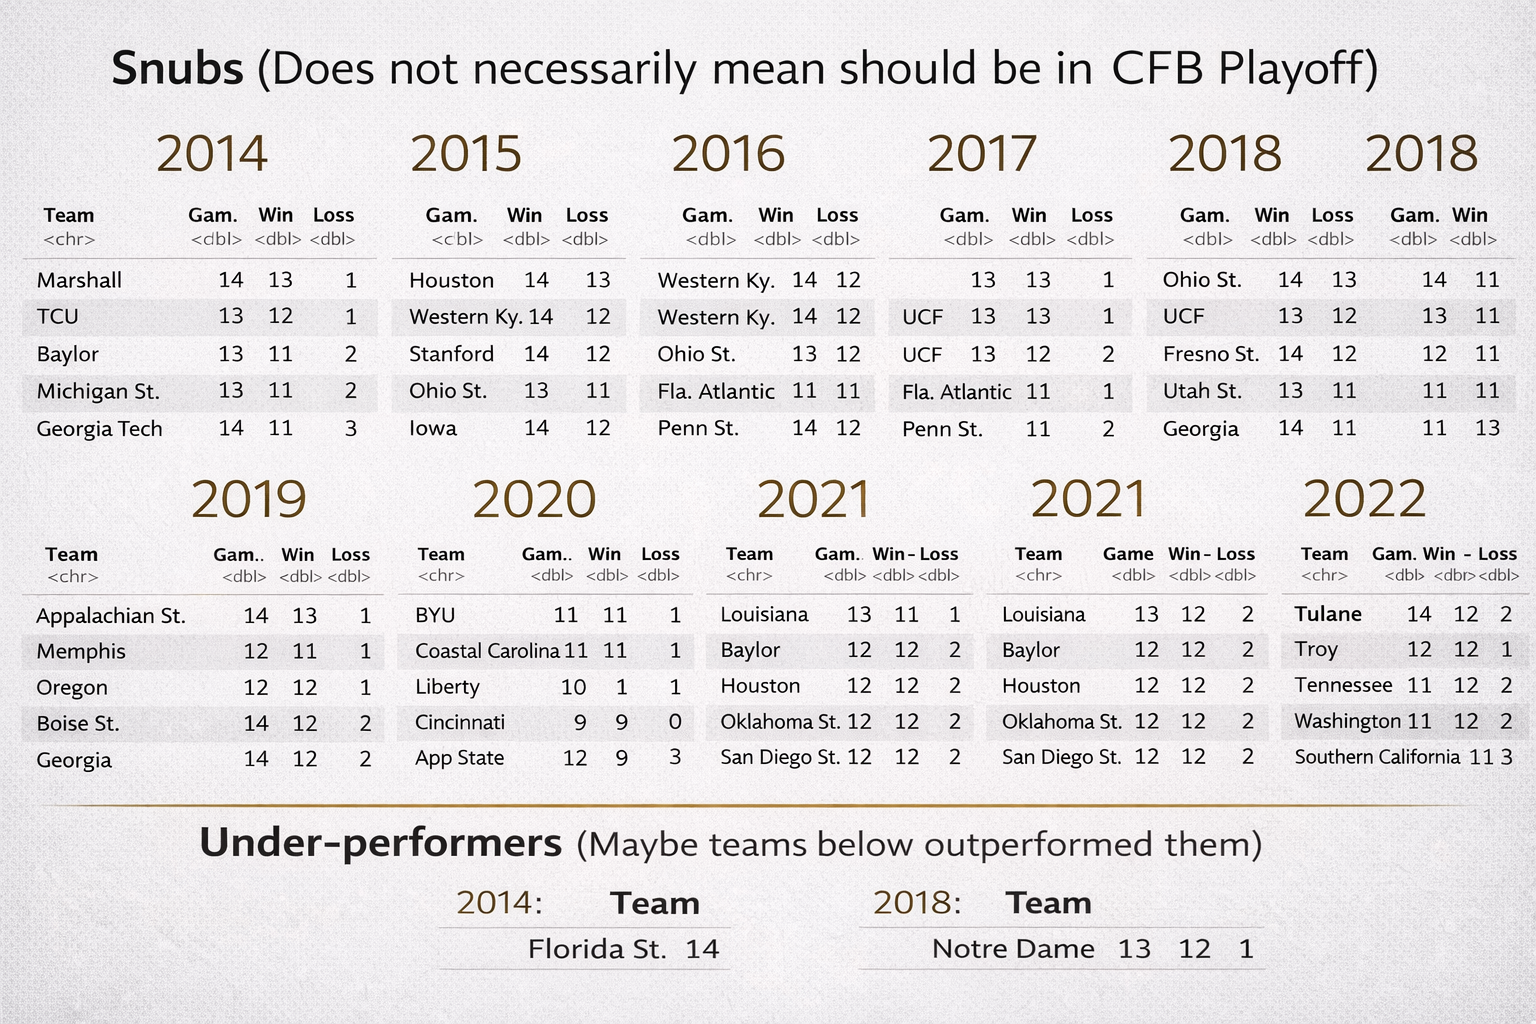
Statistical Snubs
Using the offensive and defensive models, teams were identified that had playoff-worthy statistics but did not make the CFB Playoff. These teams scored higher than the average playoff team cutoff based on the statistical models. This analysis does not necessarily mean these teams should have made the playoffs, but rather identifies which teams would be next in line based purely on statistical performance.
Underperformers
Teams that made the CFB Playoff but scored below the average of that year's statistical snubs were classified as underperformers. If a team scored below average offensively and above average defensively (indicating weaker defense - remember higher defensive stats are worse), they were considered statistical underperformers.
Identified Underperformers:
2014: Florida State (14 games)
2018: Notre Dame (13-12-1 record)
All Other Years (2015-2017, 2019-2022): No significant underperformers identified
Key Finding
The minimal number of underperformers (only 2 out of 36 playoff teams from 2014-2022) shows the CFB Playoff Committee's effectiveness in selecting teams. The statistical models largely validate the committee's decisions, with only occasional discrepancies in 2014 and 2018. This suggests that while a large number of teams meet statistical criteria for playoff selection, the committee's judgment-based approach works well in identifying the most deserving teams.
Conclusions
Linear modeling revealed high statistical correlation among playoff teams (R² > 0.86), with offense slightly outweighing defense (R² 0.904 vs 0.895) as a playoff predictor. Total season statistics (R² 0.861) proved superior to per-game averages (R² 0.368) for playoff correlation.
Conference analysis showed SEC and ACC teams with the most playoff-ready profiles, while Big 12 and Pac-12 favor offense-oriented styles and Big Ten emphasizes defensive play. The CFB Playoff Committee's selections were statistically validated, with only 2 underperformers across 9 years.